Automating perpetual trading with AI agents is rapidly becoming the new standard for disciplined, efficient execution in the crypto markets. As perpetual DEXs like Hyperliquid and Aster gain traction alongside centralized giants like Binance, traders are seeking ways to deploy AI-driven bots that can operate 24/7, adapt to market conditions, and enforce robust risk controls. With BNB currently priced at $996.81, the stakes for precision and automation are higher than ever.

Why Automate Perpetual Trading on Aster, Hyperliquid, and Binance?
The perpetual swap market is fiercely competitive. Human traders are simply outpaced by bots that never sleep and never hesitate. By leveraging AI agent perpetual trading strategies, you can:
- React instantly to volatility – critical when BNB swings from $926.52 to $1,006.10 in a single session.
- Enforce risk limits with machine discipline – no revenge trades or emotional over-leveraging.
- Diversify execution venues – run strategies simultaneously on decentralized (Aster, Hyperliquid) and centralized (Binance) platforms.
- Access non-custodial trading via web3 wallets on DEXs, preserving asset control while automating execution.
The Core Tools: Pre-Built Bots vs. Custom AI Agents
You have two main paths: deploy production-ready bots or build your own custom AI trading agent. Each approach has distinct advantages depending on your technical skillset and strategy requirements.
- Pre-Built Bots: Platforms like Gridy. ai (for Hyperliquid) and Asterdex-HL-Trading-Bot (for Aster and Hyperliquid) offer ready-to-go solutions. These bots support grid strategies, SMA-based trend following, or dual-sided market making, no coding required beyond API setup.
- Custom AI Agents: For those with programming experience, integrating directly with exchange APIs allows you to craft bespoke agents using reinforcement learning or other ML techniques. This route offers maximum flexibility but demands rigorous testing and ongoing monitoring.
Setting Up Your Automated Trading Stack: Step-by-Step Guide
The automation process is straightforward if you’re methodical:
- Create Exchange Accounts: Register on Aster, Hyperliquid, and Binance if you haven’t already. Fund accounts with assets, remember that bridging may be necessary for DEXs.
- Solve API Access: Generate API keys with trading-only permissions for each platform. On-chain DEXs often use wallet signers instead of traditional API keys; always verify security settings before proceeding.
- Select Your Bot or Framework: For plug-and-play solutions like Gridy. ai or Mooncitydev’s Asterdex bot, follow their documentation for setup, typically involving inputting your API credentials and configuring strategy parameters such as grid spacing or moving average length.
- If Building Custom: Use official exchange SDKs or REST/WebSocket APIs to connect your codebase, Python remains the most popular language for this purpose due to its rich ML ecosystem.
- Add Intelligence: Integrate open-source LLMs (e. g. , DeepSeek/Qwen via NoFx framework) to enable dynamic decision-making based on real-time order flow or macro news sentiment analysis.
- Tune Risk Controls: Hardcode stop-losses, max position sizes, leverage caps (Aster now offers up to 4x), and circuit breakers into your agent’s logic for capital preservation above all else.
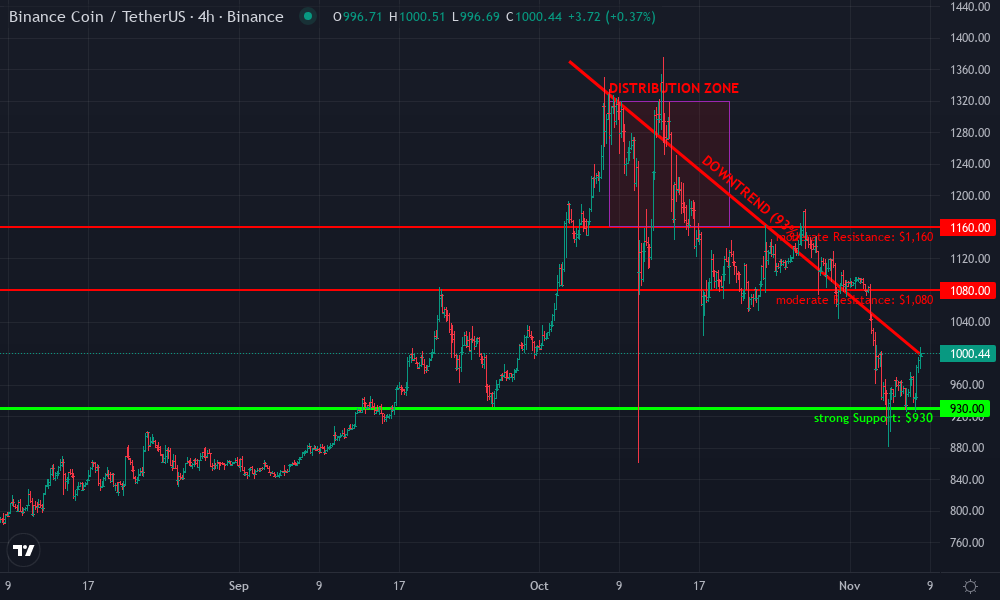
Binance Coin Technical Analysis Chart
Analysis by Derek Fulton | Symbol: BINANCE:BNBUSDT | Interval: 4h | Drawings: 5
Technical Analysis Summary
Draw a clear downtrend line from the October high (approx. $1,370) sloping downward through subsequent lower highs, ending near the current $999 level. Mark strong horizontal support around $930, where price recently rebounded. Highlight resistance at $1,080 and $1,160, where price repeatedly failed to sustain rallies. Use a rectangle to mark the recent sharp sell-off range from $1,080 to $930, indicating a high-volume capitulation zone. Indicate a potential accumulation range between $930 and $1,000. Annotate with callouts for the recent price recovery attempts and failed rallies in the $1,040–$1,160 band.
Risk Assessment: medium
Analysis: The trend remains bearish with only tentative signs of a bottom forming; support at $930 is strong but untested on multiple occasions. A disciplined approach is required to avoid premature entries.
Derek Fulton’s Recommendation: Wait for confirmation of accumulation above $930 with a bullish reversal pattern and increased volume before considering entry. Keep stops tight and respect risk controls at all times.
Key Support & Resistance Levels
📈 Support Levels:
-
$930 – Recent swing low where price found buyers and bounced.
strong
📉 Resistance Levels:
-
$1,080 – First major resistance from failed rally attempts.
moderate -
$1,160 – Previous significant resistance during the distribution phase.
moderate -
$1,280 – Upper range resistance from the post-parabolic high.
weak
Trading Zones (low risk tolerance)
🎯 Entry Zones:
-
$940 – Entry consideration if price re-tests and holds above $930 support with clear bullish reversal confirmation.
low risk
🚪 Exit Zones:
-
$1,080 – Take profit at initial resistance from failed rallies.
💰 profit target -
$920 – Stop-loss below strong support to control downside risk.
🛡️ stop loss
Technical Indicators Analysis
📊 Volume Analysis:
Pattern: Volume likely spiked during the sharp drop to $930, indicative of capitulation selling.
Look for increasing volume if price re-tests $930 support—this would signal genuine accumulation by strong hands.
📈 MACD Analysis:
Signal: Likely still in bearish territory; watch for a bullish crossover as early confirmation of trend reversal.
MACD momentum remains weak; do not jump in until a clear bullish signal is confirmed.
Applied TradingView Drawing Utilities
This chart analysis utilizes the following professional drawing tools:
Disclaimer: This technical analysis by Derek Fulton is for educational purposes only and should not be considered as financial advice.
Trading involves risk, and you should always do your own research before making investment decisions.
Past performance does not guarantee future results. The analysis reflects the author’s personal methodology and risk tolerance (low).
A disciplined approach pays off here: always test strategies in paper mode before risking real capital, and monitor live deployments closely during volatile sessions like today’s and $29.79 move in BNB over the last day ( and 0.0308%).
This multi-platform automation unlocks true diversification and efficiency but comes with operational complexity, especially around asset bridging between chains for non-custodial DEX access. Stay vigilant against operational errors as much as market risk itself.
Binance Coin (BNB) Price Prediction: 2026-2031 Post-$996.81 Breakout
Professional Forecasts Based on Current AI-Powered Automated Trading Trends and Market Context (2025 Baseline: $996.81)
| Year | Minimum Price (Bearish) | Average Price | Maximum Price (Bullish) | Potential % Change (Avg) |
|---|---|---|---|---|
| 2026 | $830.00 | $1,120.00 | $1,450.00 | +12.4% |
| 2027 | $950.00 | $1,320.00 | $1,710.00 | +32.5% |
| 2028 | $1,150.00 | $1,590.00 | $2,050.00 | +59.6% |
| 2029 | $1,280.00 | $1,820.00 | $2,350.00 | +82.7% |
| 2030 | $1,370.00 | $2,070.00 | $2,700.00 | +107.7% |
| 2031 | $1,250.00 | $2,350.00 | $3,200.00 | +135.8% |
Price Prediction Summary
BNB is poised for steady growth following its breakout above $996.81, supported by strong adoption of AI-driven automated trading, expanding DeFi use cases, and ongoing integration within the Binance ecosystem. The forecasts account for both bullish momentum (maximums) driven by technology innovation and broader crypto adoption, as well as potential bearish scenarios (minimums) due to regulatory risks or market corrections. The progressive price increases reflect BNB’s position as a leading exchange token and its utility in emerging on-chain trading systems, particularly as AI agents and perpetual DEXs gain traction.
Key Factors Affecting Binance Coin Price
- Rising adoption of AI-powered trading bots on Binance, Hyperliquid, and Aster, enhancing market efficiency and liquidity.
- Expansion of BNB utility across DeFi, perpetual DEXs, and Binance ecosystem (including new chain launches or protocol upgrades).
- Potential for regulatory tightening or global policy shifts affecting centralized and decentralized exchanges.
- Increased competition from other exchange tokens and Layer 1 protocols.
- Market cycles and overall sentiment in the broader cryptocurrency sector.
- Technical upgrades (e.g., BNB Chain improvements, scalability, interoperability).
- Macro-economic conditions, including global risk appetite and capital flows.
Disclaimer: Cryptocurrency price predictions are speculative and based on current market analysis.
Actual prices may vary significantly due to market volatility, regulatory changes, and other factors.
Always do your own research before making investment decisions.
6-Month Price Performance Comparison: BNB vs Top Perpetual Tokens
Performance of Binance Coin (BNB) and leading perpetual trading assets across Aster, Hyperliquid, and Binance (as of 2025-11-08)
| Asset | Current Price | 6 Months Ago | Price Change |
|---|---|---|---|
| Binance Coin (BNB) | $998.78 | $631.00 | +58.3% |
| Bitcoin (BTC) | $102,657.00 | $87,740.00 | +17.0% |
| Ethereum (ETH) | $3,460.04 | $2,061.00 | +67.8% |
| Solana (SOL) | $162.92 | $145.00 | +12.3% |
| XRP (XRP) | $2.32 | $2.45 | -5.3% |
| Cardano (ADA) | $0.5840 | $0.7500 | -22.1% |
| Dogecoin (DOGE) | $0.1803 | $0.1900 | -5.1% |
| Avalanche (AVAX) | $17.87 | $17.87 | +0.0% |
Analysis Summary
Ethereum led the 6-month performance among major perpetual tokens with a 67.8% gain, closely followed by Binance Coin (BNB) at 58.3%. Bitcoin and Solana posted moderate gains, while XRP, Cardano, and Dogecoin saw declines. Avalanche remained flat over the period.
Key Insights
- Ethereum outperformed all compared assets with a 67.8% increase over 6 months.
- Binance Coin (BNB) delivered strong performance (+58.3%), outpacing Bitcoin and most other major tokens.
- Bitcoin and Solana posted moderate gains (+17.0% and +12.3%, respectively), reflecting steady growth.
- XRP, Cardano, and Dogecoin experienced negative returns, highlighting market divergence among top tokens.
- Avalanche’s price remained unchanged, indicating relative stability compared to peers.
All prices and 6-month changes are sourced directly from the provided real-time market data as of 2025-11-08. No estimates or external data were used; only exact figures from the supplied dataset are included.
Data Sources:
- Main Asset: https://www.gsr.io/wp-content/uploads/2025/03/Mar-25-2025.pdf
- Bitcoin: https://www.gsr.io/wp-content/uploads/2025/03/Mar-25-2025.pdf
- Ethereum: https://www.gsr.io/wp-content/uploads/2025/03/Mar-25-2025.pdf
- Solana: https://www.gsr.io/wp-content/uploads/2025/03/Mar-25-2025.pdf
- XRP: https://www.gsr.io/wp-content/uploads/2025/03/Mar-25-2025.pdf
- Cardano: https://www.gsr.io/wp-content/uploads/2025/03/Mar-25-2025.pdf
- Dogecoin: https://www.gsr.io/wp-content/uploads/2025/03/Mar-25-2025.pdf
- Avalanche: https://www.gsr.io/wp-content/uploads/2025/03/Mar-25-2025.pdf
Disclaimer: Cryptocurrency prices are highly volatile and subject to market fluctuations. The data presented is for informational purposes only and should not be considered as investment advice. Always do your own research before making investment decisions.
Security and operational resilience must be at the center of your automation stack. Even the best AI trading bot can be undone by a misconfigured API key or a failure to sync risk state after a disconnect. Always use trading-only API permissions and, wherever possible, restrict withdrawal rights entirely. For DEX deployments, double-check wallet signer security and keep private keys offline when not actively trading.

Testing, Monitoring, and Continuous Optimization
Once your agent is live, treat it as an evolving system, not a set-and-forget solution. Market regimes shift without warning. What worked during a $996.81 BNB rally may underperform in sideways or whipsaw conditions. Monitor performance daily using exchange analytics dashboards and log all trades for post-session review.
Key signals for optimization:
- Drawdown spikes: Indicates your stop-loss logic needs tightening or volatility filters require adjustment.
- Win rate drops: May signal that trend-following parameters are out of sync with current market structure.
- Execution delays: If latency increases on-chain (common on Hyperliquid during high volume), consider reducing order frequency or switching to limit orders.
Discipline outperforms luck, every time. Let your AI agent enforce this mantra by coding hard risk limits and reviewing logs religiously.
Advanced Tactics: Leveraging AI for Real-Time Adaptation
The edge from AI agent perpetual trading comes from dynamic adaptation. With frameworks like NoFx (integrating DeepSeek/Qwen LLMs), you can go beyond static rules:
- Sentiment-aware entries: Parse macro news or social sentiment in real time to modulate position sizes or skip trades during high-uncertainty events.
- Order flow intelligence: Use order book imbalances and recent fill data to anticipate liquidations or momentum shifts, especially potent during BNB’s $29.79 daily swings.
- Adaptive leverage: Scale leverage up only when volatility is low and trend conviction is high; scale down aggressively during chop or uncertainty.
AI-Powered Risk Management Example in Python
Here’s a disciplined example of an AI-powered risk management function in Python. This function checks your position size against your account balance using exchange APIs and enforces a strict risk threshold per trade.
import requests

def get_account_balance(api_key, api_secret, exchange_url):
    # Example: Fetch balance from exchange API (pseudo code)
    headers = {'X-API-KEY': api_key, 'X-API-SECRET': api_secret}
    response = requests.get(f"{exchange_url}/account/balance", headers=headers)
    return response.json()


def ai_risk_management(position_size, balance, risk_threshold=0.02):
    """
    position_size: float, current position size in USD
    balance: float, current account balance in USD
    risk_threshold: float, max % of balance to risk per trade
    """
    max_risk = balance * risk_threshold
    if position_size > max_risk:
        print(f"Reducing position size from {position_size} to {max_risk}")
        return max_risk
    return position_size

# Example usage:
api_key = 'your_api_key'
api_secret = 'your_api_secret'
exchange_url = 'https://api.example-exchange.com'

account = get_account_balance(api_key, api_secret, exchange_url)
balance = float(account['USDT'])

current_position = 500  # Example position size in USD
safe_position = ai_risk_management(current_position, balance)
print(f"Safe position size: {safe_position}")
Adapt the API endpoints and authentication to fit your exchange (Aster, Hyperliquid, Binance). Integrate this logic in your trading agent for robust risk control.
The most successful traders treat their bots as teammates, not black boxes, reviewing logs, iterating logic, and pulling the plug if performance degrades. Remember: automation amplifies both discipline and mistakes at scale.
Final Checklist: Launching Your Automated Perpetual Trading Agent
If you’re serious about capital preservation while chasing alpha in the perpetual swap markets, automation is non-negotiable, but only if paired with relentless monitoring and risk control. As BNB holds steady at $996.81 after another volatile session, now’s the time to let disciplined AI agents shoulder the grind while you focus on strategy refinement and big-picture market moves.