
With Bitcoin (BTC) currently holding at $115,453.00, the sophistication of crypto portfolio management tools has never been more critical. AI trading agents are now at the forefront of this evolution, offering unprecedented automation and intelligence for both retail and institutional investors. However, the architecture of these agents, whether they operate on-chain or off-chain, directly impacts transparency, efficiency, and security in digital asset management.

On-Chain AI Trading Agents: Security Meets Transparency
On-chain AI trading agents execute their logic directly within blockchain environments via smart contracts. This design delivers immutable transparency: every trade, rebalancing move, and risk control mechanism is recorded on the public ledger. For users prioritizing auditability and trustlessness, this is a compelling advantage.
Security is another hallmark. On-chain agents leverage blockchain’s native protection against tampering and unauthorized access. There are no centralized servers that can be compromised; all operations are governed by code visible to anyone with a block explorer.
However, there are trade-offs:
- Computational Constraints: Blockchains have limited processing power compared to traditional servers, restricting the complexity of on-chain AI models.
- Higher Costs: Every transaction incurs gas fees, especially notable during market volatility when network congestion spikes costs.
- Latency: On-chain trades settle more slowly due to network confirmation times.
Pioneering projects like Giza exemplify the progress in this space: their ARMA agent has autonomously executed over 100,000 trades while optimizing more than $30 million in user capital (cryptonews.com). As decentralized finance (DeFi) matures, expect further innovations in on-chain agent efficiency and capability.
Off-Chain Crypto Trading Bots: Powering Complex Strategies
In contrast, off-chain crypto trading bots operate outside blockchain constraints, typically running on cloud infrastructure or dedicated servers. This architecture unlocks several key advantages:
- Advanced Computation: Off-chain bots can harness robust GPUs/TPUs for deep learning models that would be infeasible to deploy directly on chain.
- Diverse Data Inputs: They can integrate not only blockchain data but also order book depth from centralized exchanges, macroeconomic signals, social sentiment feeds, and more.
- Low Cost and Speed: Without gas fees or block confirmation delays, off-chain bots execute trades rapidly and cost-effectively, crucial for high-frequency strategies.
The primary downside? Lack of inherent transparency. Trades executed off chain may not be immediately visible or auditable by third parties until they’re settled on chain or reported via external proofs. This introduces potential counterparty risk, a factor highlighted by recent research (arxiv.org) into hybrid architectures using zero-knowledge proofs to bridge trust gaps between off- and on-chain execution layers.
Comparative Performance Analysis With Current BTC Market Data
The operational environment of your chosen AI agent will shape your portfolio’s risk profile as much as your asset allocation strategy. Today’s market underscores the need for agility: with BTC fluctuating between $117,867.00 (24h high) and $115,438.00 (24h low), rapid response times are essential, but so is security against manipulation or error.
Bitcoin (BTC) Price Prediction Table: 2026-2031
Professional BTC forecast based on current price ($115,453.00) and evolving AI trading agent landscape (On-Chain vs Off-Chain)
| Year | Minimum Price (Bearish) | Average Price (Base Case) | Maximum Price (Bullish) | Yearly % Change (Avg) | Key Market Scenario |
|---|---|---|---|---|---|
| 2026 | $89,000 | $125,000 | $158,000 | +8.3% | AI agent adoption drives steady growth; regulatory clarity improves |
| 2027 | $105,000 | $142,000 | $188,000 | +13.6% | Institutional participation rises; hybrid on/off-chain AI strategies mature |
| 2028 | $117,000 | $162,000 | $218,000 | +14.1% | Mainstream DeFi/AI integration; competition from new L1s |
| 2029 | $131,000 | $182,000 | $255,000 | +12.3% | Global regulations stabilize; Bitcoin viewed as digital reserve |
| 2030 | $150,000 | $205,000 | $295,000 | +12.6% | Wider tokenization, asset inflows from TradFi; AI trading dominates |
| 2031 | $170,000 | $230,000 | $340,000 | +12.2% | Bitcoin scarcity narrative strengthens; macroeconomic uncertainty benefits BTC |
Price Prediction Summary
Bitcoin is expected to show steady long-term growth, with the average price potentially rising from $125,000 in 2026 to $230,000 by 2031. The bullish scenario could see BTC approach $340,000 if AI-driven portfolio management, regulatory clarity, and institutional adoption accelerate. However, downside risks remain, with the minimum scenario projecting a possible drop to $89,000 in 2026 in the event of adverse regulations or major market corrections. Overall, the outlook remains positive, supported by the increasing integration of AI trading agents and the maturation of both on-chain and off-chain crypto infrastructure.
Key Factors Affecting Bitcoin Price
- Adoption of AI trading agents (on-chain and off-chain) improving market efficiency
- Global regulatory developments and potential for spot ETF approvals
- Macroeconomic conditions (inflation, monetary policy, geopolitical risk)
- Institutional adoption and capital inflows
- Technological advances in blockchain and Layer 2 scaling solutions
- Competition from alternative Layer 1 blockchains and tokenization platforms
- Market cycles and Bitcoin halving events
- Security and transparency trade-offs in AI agent deployment
Disclaimer: Cryptocurrency price predictions are speculative and based on current market analysis.
Actual prices may vary significantly due to market volatility, regulatory changes, and other factors.
Always do your own research before making investment decisions.
Bitcoin Technical Analysis Chart
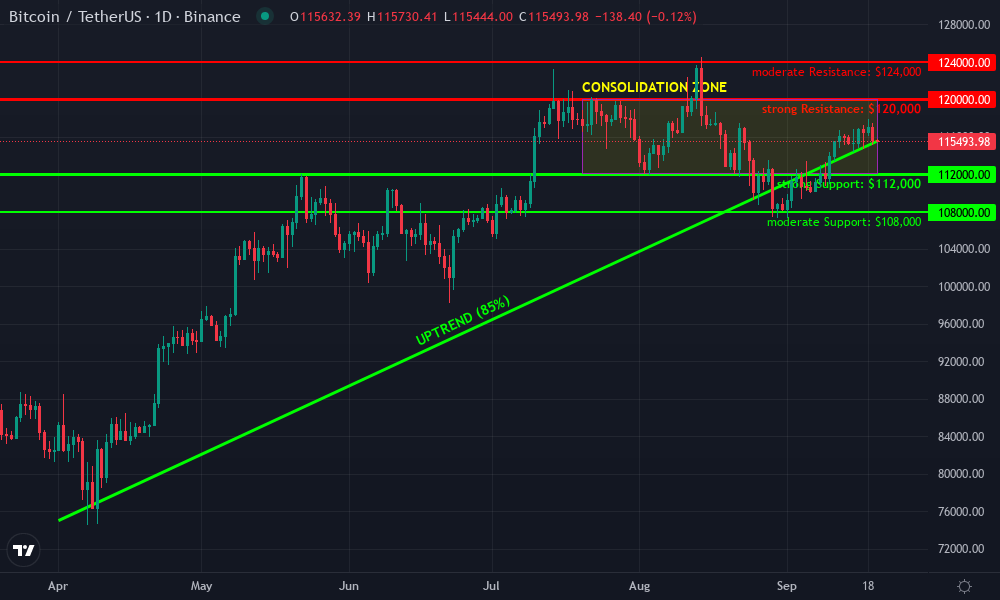
Analysis by Market Analyst | Symbol: BINANCE:BTCUSDT | Interval: 1D | Drawings: 6
Technical Analysis Summary
Begin by drawing a primary uptrend line from the late March/early April lows (around $75,000) ascending through subsequent higher lows in May, June, and July. Add a horizontal resistance line at the $120,000 area, as this level has repeatedly capped price advances in July and August. Mark a secondary support zone near $112,000, where the recent consolidation and several candle wicks found buyers. Draw a rectangle for the consolidation range between $112,000 and $120,000 from late July to the present. Highlight the most recent local high (early August, just above $124,000) and pull a horizontal line there as well. Use a fib retracement from the last major swing low (around $108,000 in late August) to the $124,000 high for potential retracement targets. Place a long position entry around $112,000 with a moderate stop below $108,000 and a profit target at $120,000 and $124,000. Mark volume callouts if visible (bottom of chart), and, if MACD is available, note any bullish or bearish crossovers during the most recent rally and pullback.
Risk Assessment: medium
Analysis: Current price action is mid-range within a consolidation zone; opportunities exist at support/resistance extremes, but whipsaw risk is elevated unless a breakout or breakdown occurs.
Market Analyst’s Recommendation: Wait for either a clear retest of $112,000 support for long entries or confirmed breakout above $120,000 for momentum trades. Tighten stops to limit downside risk; avoid aggressive entries mid-range.
Key Support & Resistance Levels
📈 Support Levels:
-
$112,000 – Recent consolidation support; price has bounced multiple times from this area.
strong -
$108,000 – Last swing low in August; would act as major support if $112,000 breaks.
moderate
📉 Resistance Levels:
-
$120,000 – Multiple rejections in July, August, and September; clear range top.
strong -
$124,000 – Local high from early August; potential breakout target.
moderate
Trading Zones (medium risk tolerance)
🎯 Entry Zones:
-
$112,000 – Potential long on strong support and range low; risk defined by nearby lows.
medium risk
🚪 Exit Zones:
-
$120,000 – Take profit at established resistance top of range.
💰 profit target -
$124,000 – Extended profit target if breakout occurs.
💰 profit target -
$108,000 – Stop loss below August swing low; invalidates the uptrend.
🛡️ stop loss
Technical Indicators Analysis
📊 Volume Analysis:
Pattern: Volume appears stable through consolidation, with no major spikes indicating accumulation or distribution.
Lack of volume surges during recent rallies suggests breakout attempts may lack conviction.
📈 MACD Analysis:
Signal: Neutral to slightly bullish if MACD is above zero; confirm with crossover on breakout.
MACD likely consolidating in line with price; watch for bullish crossover on breakout from $120,000.
Applied TradingView Drawing Utilities
This chart analysis utilizes the following professional drawing tools:
Disclaimer: This technical analysis by Market Analyst is for educational purposes only and should not be considered as financial advice.
Trading involves risk, and you should always do your own research before making investment decisions.
Past performance does not guarantee future results. The analysis reflects the author’s personal methodology and risk tolerance (medium).
The Hybrid Model: Swarm Contracts and Multi-Agent Systems
A new generation of solutions aims to combine the best of both worlds through hybrid models like Swarm Contracts operating within Trusted Execution Environments (TEEs). Here’s how it works:
- Collaborative Agents: Multiple digital entities coordinate tasks both on chain (for settlement/audit) and off chain (for real-time analysis).
- Balance of Trust and Efficiency: TEEs ensure sensitive computations remain private while final decisions are transparently recorded via smart contracts (arxiv.org).
This approach is gaining traction as market participants demand both transparency for compliance/audit purposes and computational flexibility for alpha generation.