
Crypto markets have always been a reflection of collective sentiment. In 2025, the fusion of AI trading agents and real-time social sentiment analysis is transforming how traders anticipate trends and manage risk. With Bitcoin (BTC) currently priced at $115,811.00, the stakes for catching even small shifts in mood are higher than ever. Today’s AI-powered trading bots don’t just crunch numbers - they decode the heartbeat of the crypto community across platforms like Twitter, Reddit, Telegram, and Discord.
How AI Trading Agents Decode Social Sentiment
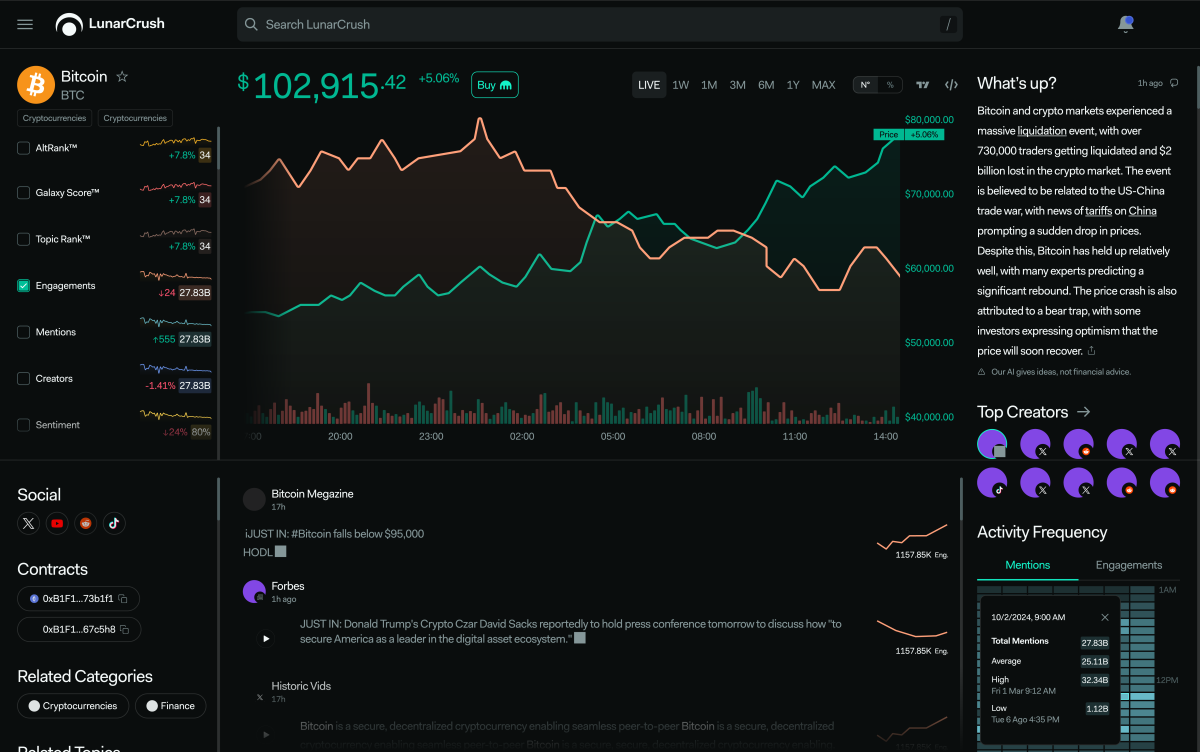
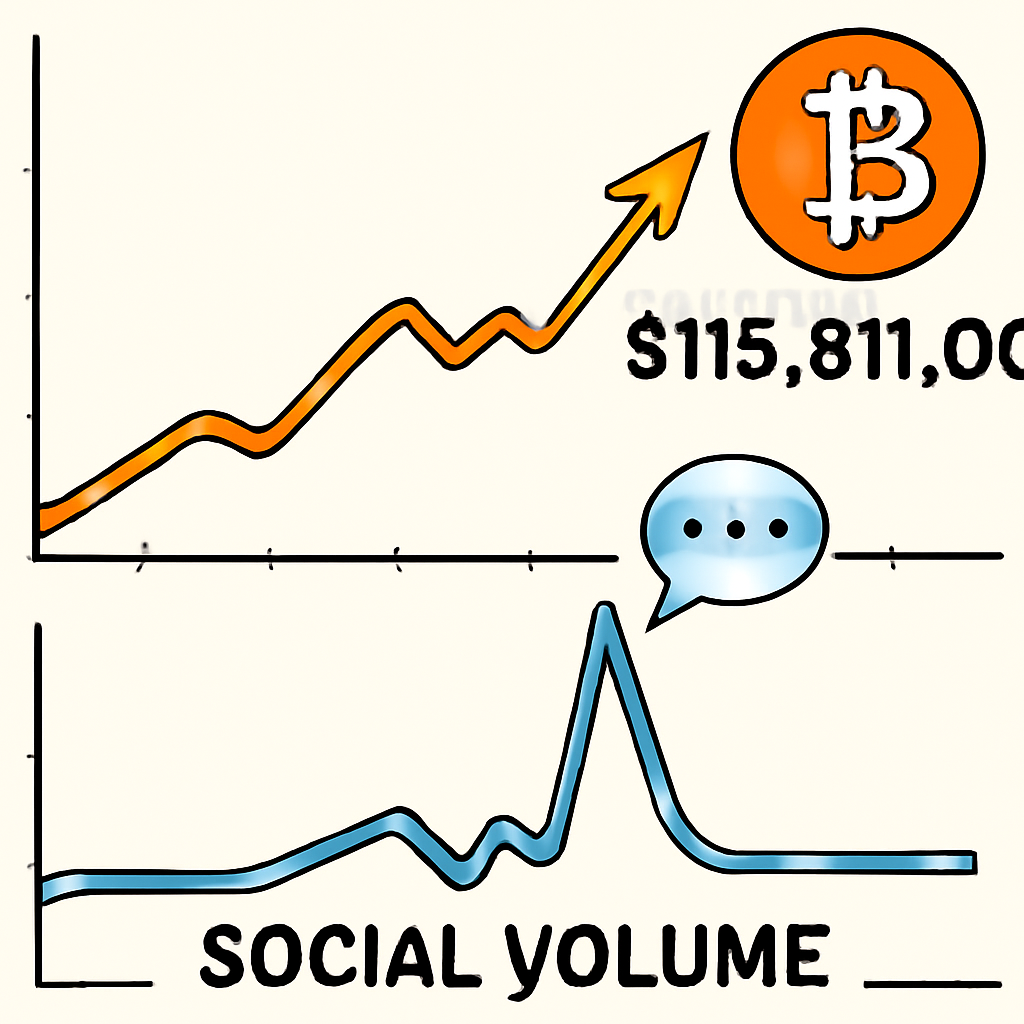
At the core of this revolution are natural language processing (NLP) algorithms. These advanced systems sift through millions of posts, comments, and news headlines every minute. Platforms such as LunarCrush and Santiment aggregate these signals into actionable data points like “social volume” and “engagement spikes. ” When a trending topic or a viral tweet emerges, these AI agents detect it instantly - often before human traders even notice.
This approach isn’t limited to surface-level mood tracking. Modern AI trading agents analyze context, slang, sarcasm, and even cross-platform sentiment divergence. For instance, a bullish surge on mainstream media might be met with skepticism by crypto-native forums - AI picks up on these nuances to avoid false positives.
Combining Social Sentiment with Technical Analysis
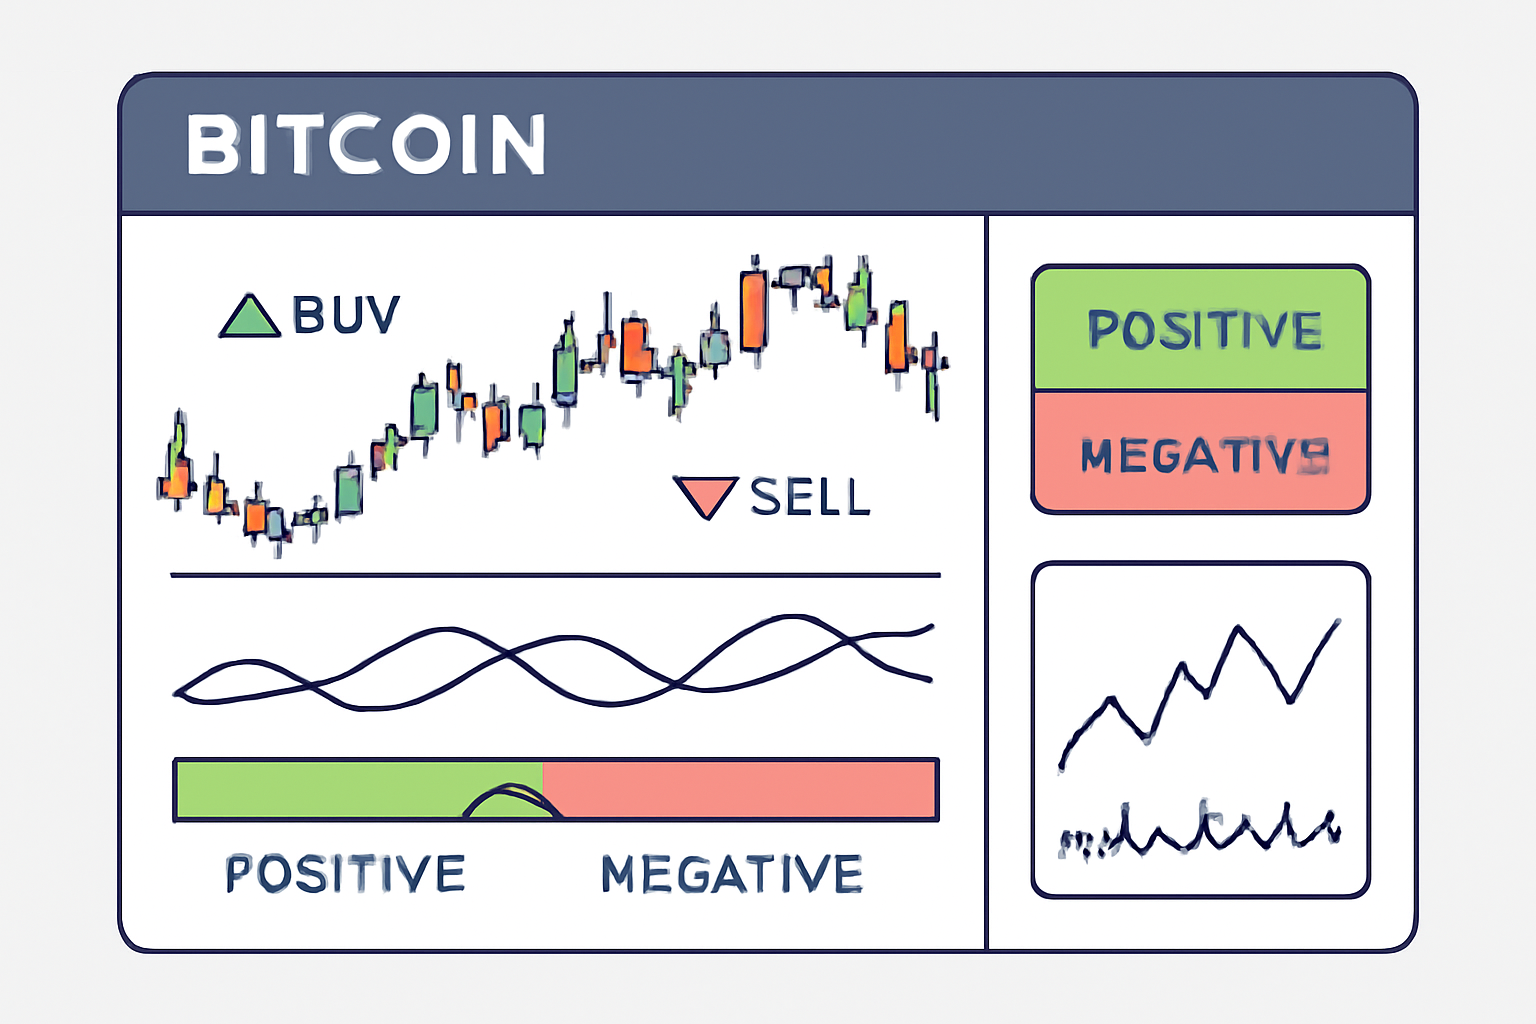
The real power comes when AI merges social sentiment data with traditional technical indicators. By overlaying market mood on top of order book depth, moving averages, and historical price action, these bots generate a multidimensional view of the market’s pulse. This is especially valuable in today’s environment where emotions drive volatility.
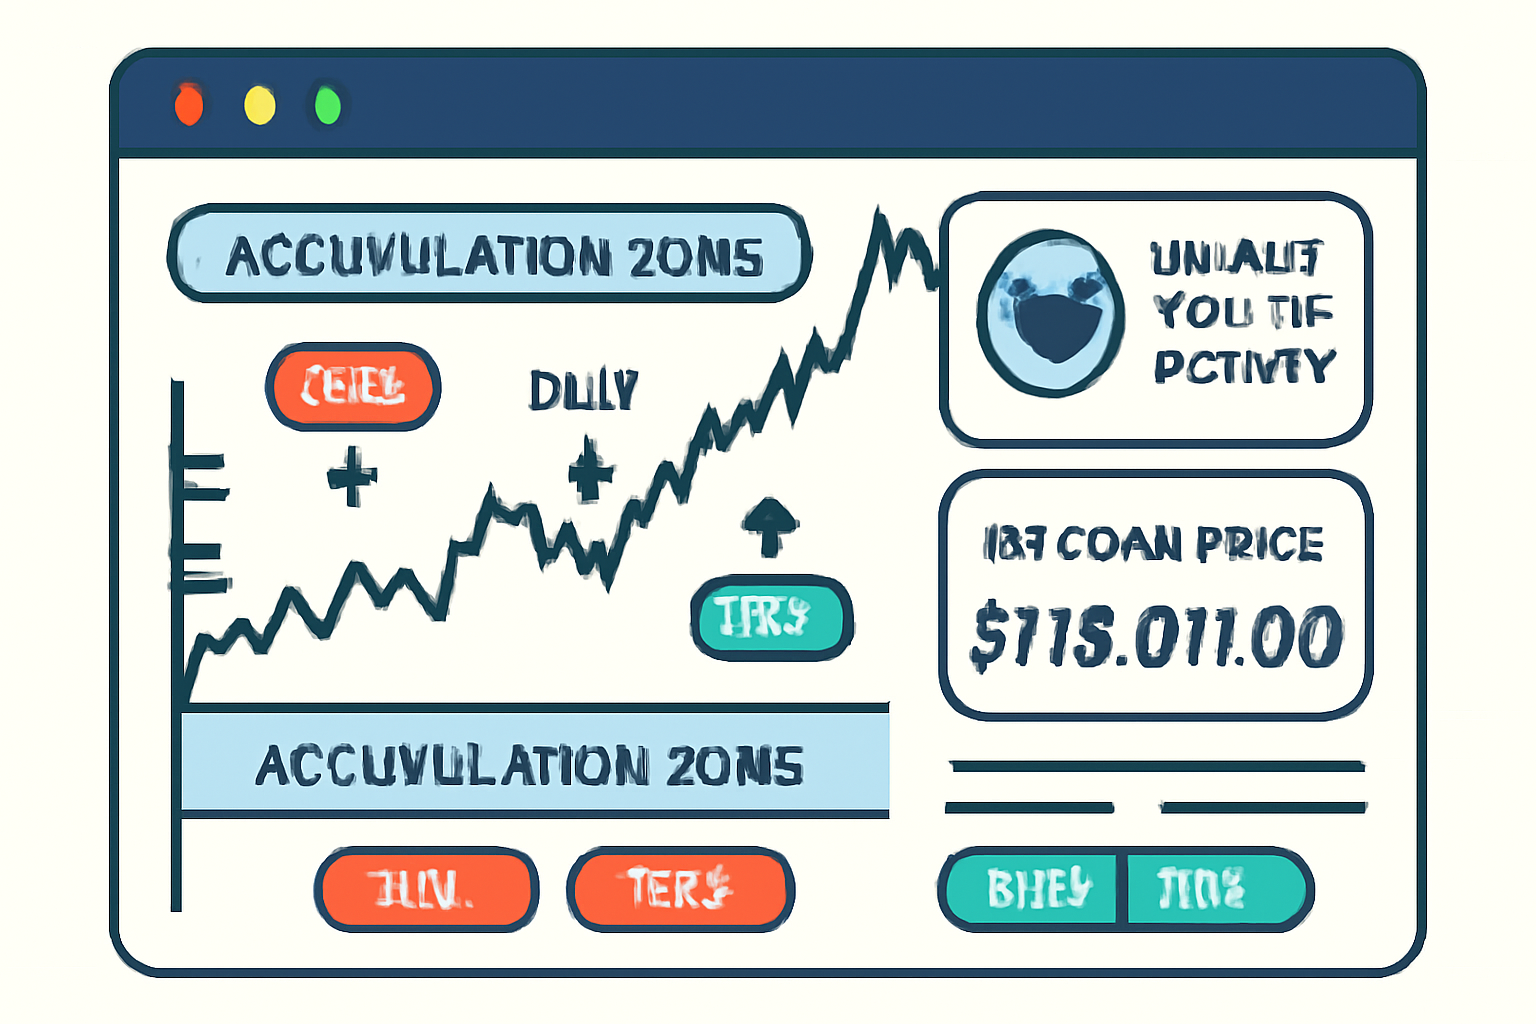
Take TensorCharts as an example: its machine learning models process real-time order flow alongside social chatter. In March 2025, TensorCharts flagged accumulation patterns in Bitcoin wallets just as social volume spiked - a precursor to BTC’s dramatic rally past $110,000. By integrating both quantitative and qualitative signals, AI trading agents can spot trend reversals or breakouts before they become obvious to manual traders.
Bitcoin Technical Analysis Chart
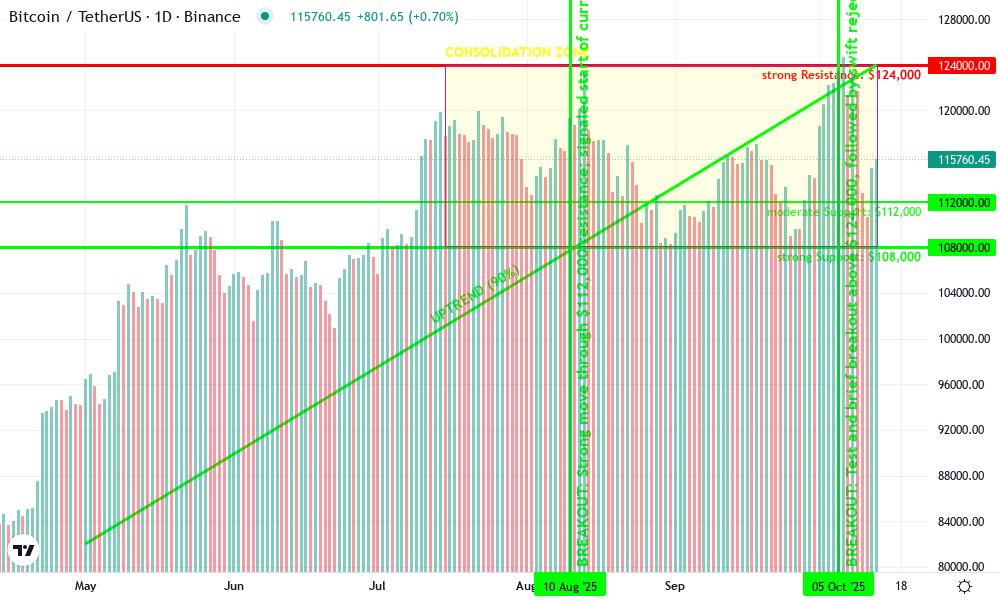
Analysis by Maya Jennings | Symbol: BINANCE:BTCUSDT | Interval: 1D | Drawings: 7
Technical Analysis Summary
Begin by plotting an ascending trend line from the May 2025 lows near $82,000 up to the recent October peaks above $124,000. Add horizontal resistance at $124,000 and strong support at $108,000, which has repeatedly acted as a rebound zone. Highlight a primary consolidation range from $108,000 to $124,000 for the last three months, marking this as a key area for accumulation/distribution. Use rectangles to visualize this range. Indicate potential entry zones on pullbacks to $112,000-$110,000, with profit targets near $124,000 and stops below $108,000. Add vertical lines to mark significant spikes in volume and price movement, especially in early August and October. As the chart is a daily, use text callouts to annotate the most relevant price action inflections and zones of interest.
Risk Assessment: medium
Analysis: While the uptrend is intact and institutional accumulation appears ongoing, the repeated failure to break $124,000 signals caution. The risk is balanced by strong support at $108,000, but a loss of this level could trigger sharp downside. Tight stops and flexible targets are warranted.
Maya Jennings's Recommendation: Favor entries on constructive pullbacks with stops below $108,000. Watch for real-time sentiment shifts—especially those flagged by AI platforms—for early warning of momentum changes.
Key Support & Resistance Levels
📈 Support Levels:
- $108,000 - Strong multi-touch support zone; repeated bounces signal institutional interest. strong
- $112,000 - Moderate support; recent short-term lows and consolidation. moderate
📉 Resistance Levels:
- $124,000 - Major horizontal resistance; repeatedly capped rallies since August. strong
Trading Zones (medium risk tolerance)
🎯 Entry Zones:
- $112,000 - Pullback into prior support and range midpoint; offers risk-adjusted entry. medium risk
- $110,000 - Deeper pullback for aggressive entries, aligning with accumulation wicks. medium risk
🚪 Exit Zones:
- $124,000 - Take profit at range resistance; high probability of selling pressure. 💰 profit target
- $108,000 - Stop loss below structural support to avoid deeper drawdown. 🛡️ stop loss
Technical Indicators Analysis
📊 Volume Analysis:
Pattern: Consistent volume spikes during rallies, especially at range boundaries.
Volume surges align with breakouts and swift reversals—suggesting active participation by large players.
📈 MACD Analysis:
Signal: No direct MACD visible, but price structure and momentum suggest bullish bias while above $112,000.
If MACD were plotted, expect histogram to be positive while price holds above $112,000-$115,000.
Applied TradingView Drawing Utilities
This chart analysis utilizes the following professional drawing tools:
Disclaimer: This technical analysis by Maya Jennings is for educational purposes only and should not be considered as financial advice. Trading involves risk, and you should always do your own research before making investment decisions. Past performance does not guarantee future results. The analysis reflects the author's personal methodology and risk tolerance (medium).
Real-Time Data Processing for Market Responsiveness
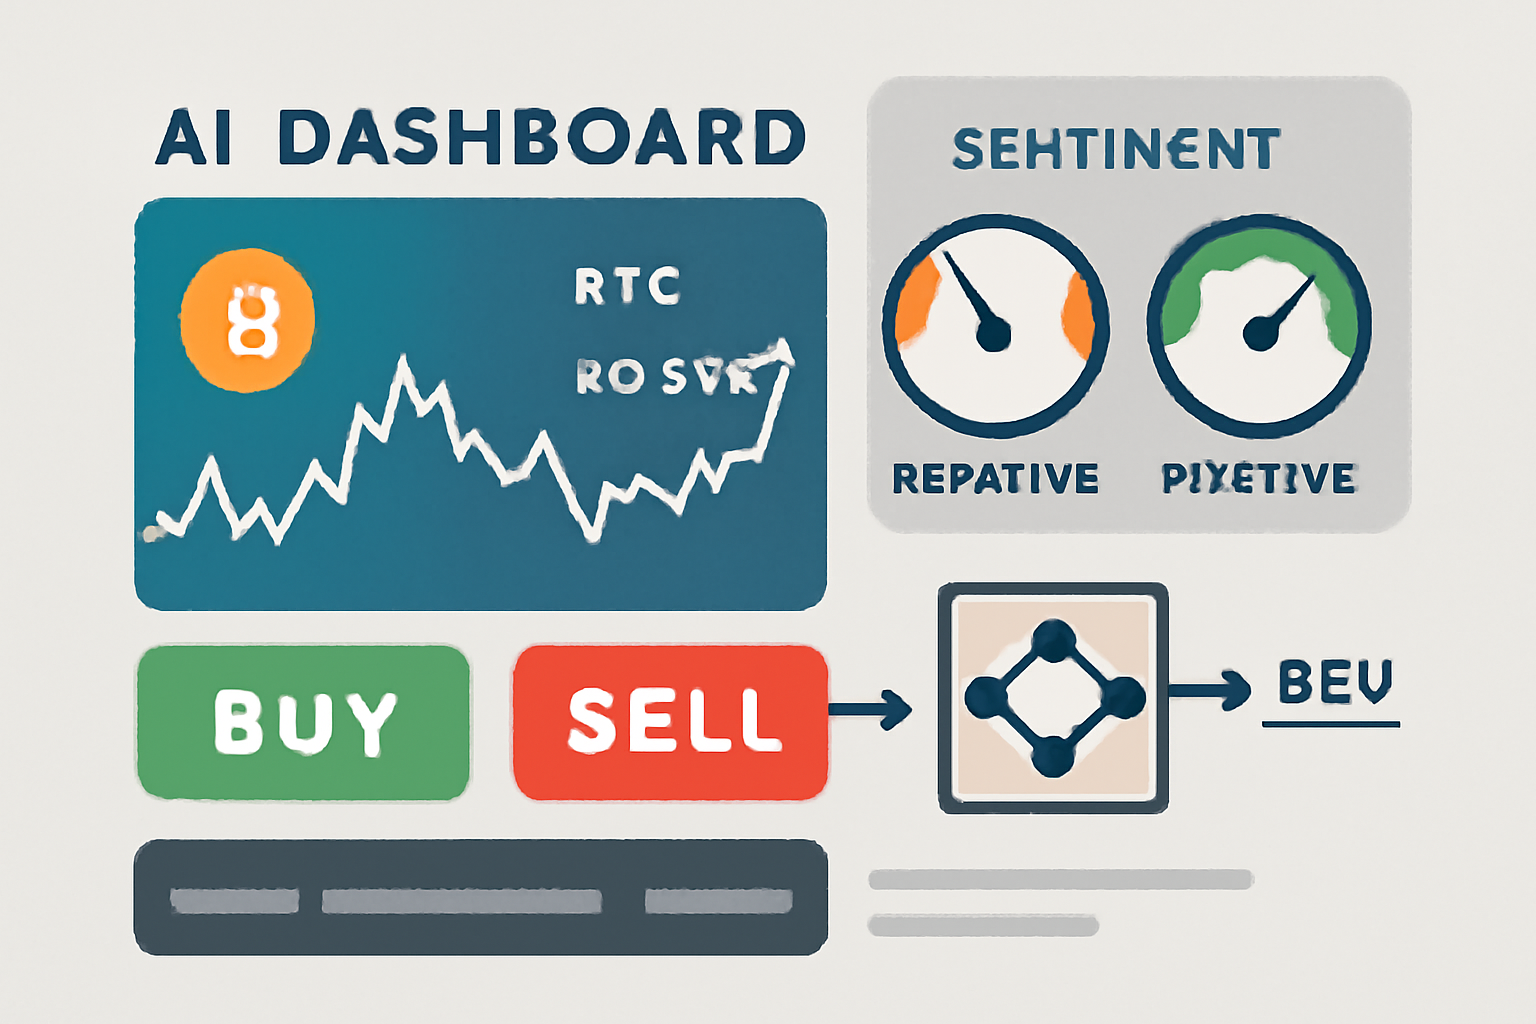
The speed at which these systems operate is game-changing. Autonomous trading bots now process thousands of data points per second from news feeds, forums, and price feeds alike. This enables dynamic strategy adjustments as soon as new sentiment or technical triggers emerge.
KryptoOracle exemplifies this agility by leveraging Spark-based architecture for high-frequency NLP queries on Twitter data. The result? Learning algorithms that adapt instantly to fresh information - supporting faster decision-making during critical market events like regulatory announcements or whale wallet movements.
This relentless focus on real-time adaptation is why agentic DeFi tools are rapidly gaining traction among both institutional desks and retail traders seeking an edge over slower-moving strategies.
Bitcoin (BTC) Price Prediction Table: 2026-2031 (AI-Driven Social Sentiment Analysis)
Short- to Mid-Term Outlook Based on Real-Time Social Sentiment, Technical Trends, and Market Dynamics
| Year | Minimum Price | Average Price | Maximum Price | Estimated % Change (Avg) | Market Scenario Insights |
|---|---|---|---|---|---|
| 2026 | $91,000 | $124,000 | $150,000 | +7% | Potential post-halving retrace; sentiment-driven volatility; regulatory uncertainty. |
| 2027 | $105,000 | $137,500 | $172,000 | +11% | Renewed institutional interest; improving adoption; cautious optimism. |
| 2028 | $120,000 | $154,000 | $195,000 | +12% | Bullish sentiment from tech advancements and ETF flows; macroeconomic factors supportive. |
| 2029 | $135,000 | $173,000 | $220,000 | +12% | Possible market cycle peak; social sentiment may drive sharp swings; competition from altcoins increases. |
| 2030 | $110,000 | $160,000 | $210,000 | -8% | Potential correction after cycle peak; regulatory tightening; AI agents mitigate drawdowns. |
| 2031 | $125,000 | $178,000 | $235,000 | +11% | Recovery and new growth phase; expanding use cases; AI-driven trading dominates. |
Price Prediction Summary
Bitcoin’s price outlook from 2026 to 2031, as informed by AI trading agents utilizing real-time social sentiment, suggests a generally upward trajectory with periodic corrections. The integration of sentiment analysis and technical indicators enables more responsive and accurate predictions, reflecting both bullish potential and the risks of volatility. Average prices are forecast to rise from $124,000 in 2026 to $178,000 by 2031, with maximum prices potentially reaching $235,000 in a bullish scenario. Market cycles, regulatory shifts, and technology adoption remain key drivers. Investors should be prepared for both rapid rallies and corrective phases as sentiment and external factors shift.
Key Factors Affecting Bitcoin Price
- Integration of real-time social sentiment analysis with AI trading agents enhances predictive accuracy and market responsiveness.
- Bitcoin halving cycles and macroeconomic conditions (e.g., interest rates, inflation) influence long-term price action.
- Regulatory changes and institutional adoption can trigger both positive and negative sentiment swings.
- Advancements in AI and blockchain technology may expand Bitcoin’s utility and perceived value.
- Competition from alternative cryptocurrencies and evolving market structure may affect Bitcoin’s dominance.
- Geopolitical events, security incidents, or black swan events could introduce unexpected volatility.
Disclaimer: Cryptocurrency price predictions are speculative and based on current market analysis. Actual prices may vary significantly due to market volatility, regulatory changes, and other factors. Always do your own research before making investment decisions.
Case Study: Bitcoin Maintains Position Above $115,000
The ability to remain responsive to shifting moods was recently put to the test when Bitcoin stabilized above $115,000. As news broke about major institutional inflows and positive regulatory signals in Asia, AI trading agents detected a sharp uptick in bullish sentiment across Telegram channels - even before prices reflected the optimism.
This early signal allowed proactive bots to build long positions ahead of the crowd while dynamically managing downside risk if sentiment cooled off unexpectedly.
Such agility isn’t just about being first to the trade, it’s about risk management and capital preservation. When AI agents identify sudden swings in public mood, they can tighten stop losses, reduce exposure, or even pivot strategies entirely. This is particularly vital in the current market, with Bitcoin holding steady at $115,811.00, where a single viral post or regulatory headline can send prices swinging by thousands of dollars within minutes.
Key Benefits of Real-Time Social Sentiment in Crypto Trading
For traders leveraging real-time social sentiment through AI trading agents, several strategic advantages emerge:
How AI Trading Agents Use Real-Time Social Sentiment to Predict Crypto Trends
1. Early Trend Detection: AI bots can spot growing bullish or bearish trends before they manifest on price charts, giving traders a critical head start.
2. Enhanced Portfolio Diversification: By monitoring sentiment across hundreds of coins and tokens simultaneously, these systems help identify hidden opportunities beyond the top market caps.
3. Automated Risk Controls: Bots adjust positions based on live mood shifts, reducing risk during FUD (Fear, Uncertainty, Doubt) waves and scaling up during periods of sustained optimism.
4. Emotional Bias Reduction: Removing human emotion from decision-making leads to more consistent outcomes over time.
5.24/7 Market Coverage: Crypto never sleeps; neither do autonomous trading bots powered by social sentiment analysis.
The integration of platforms like LunarCrush, Santiment, and KryptoOracle is making it possible for even smaller investors to access institutional-grade analytics once reserved for hedge funds. This democratization is reshaping what’s possible in agentic DeFi and autonomous trading.
Challenges and Evolving Best Practices
No system is infallible, especially when it comes to interpreting the complex world of online chatter. False signals from coordinated shilling campaigns or bot-driven hype can mislead even well-trained algorithms. As a result, leading AI trading agents are increasingly combining multiple data streams (order book depth, historical volatility metrics, whale wallet tracking) with social sentiment to filter out noise and avoid costly mistakes.
The best-performing bots are those that continually retrain their models on new data and adapt to emerging patterns, an ongoing process as language evolves and crypto communities shift platforms or slang.
Looking Forward: The Future of AI-Driven Trend Prediction
The next frontier lies in further integrating AI-powered trend prediction with liquidity mesh protocols and cross-chain analytics. Imagine an agentic DeFi landscape where bots not only react to sentiment but also optimize liquidity provision across decentralized exchanges based on predictive mood shifts.
The implications are profound: smarter execution strategies, reduced slippage during volatile periods, and more resilient portfolios that thrive amid uncertainty. As these tools mature, expect greater transparency around how signals are generated, and a new wave of innovation at the intersection of machine intelligence and collective market psychology.
If you’re serious about staying ahead as a trader or investor in 2025’s dynamic crypto environment, embracing real-time social sentiment through advanced AI agents isn’t just an edge, it’s fast becoming essential.


No comments yet. Be the first to share your thoughts!